Transform live event data into compelling visuals. Learn techniques for real-time dashboards, word clouds, and interactive charts that engage audiences.
Live events generate a wealth of data, from audience engagement to social media buzz. Transforming this raw information into digestible, real-time visuals is crucial for both organizers and attendees. Effective data visualization techniques can elevate the live event experience significantly.
Problem/Challenge
Managing and interpreting the deluge of data produced during a live event presents a significant challenge. Without proper visualization, valuable insights remain hidden, making it difficult to react swiftly or communicate effectively. This can lead to missed opportunities for engagement and optimization.
- Overwhelming data volume
- Lack of real-time insights
- Difficulty in audience engagement
- Inefficient decision-making
Solution Overview
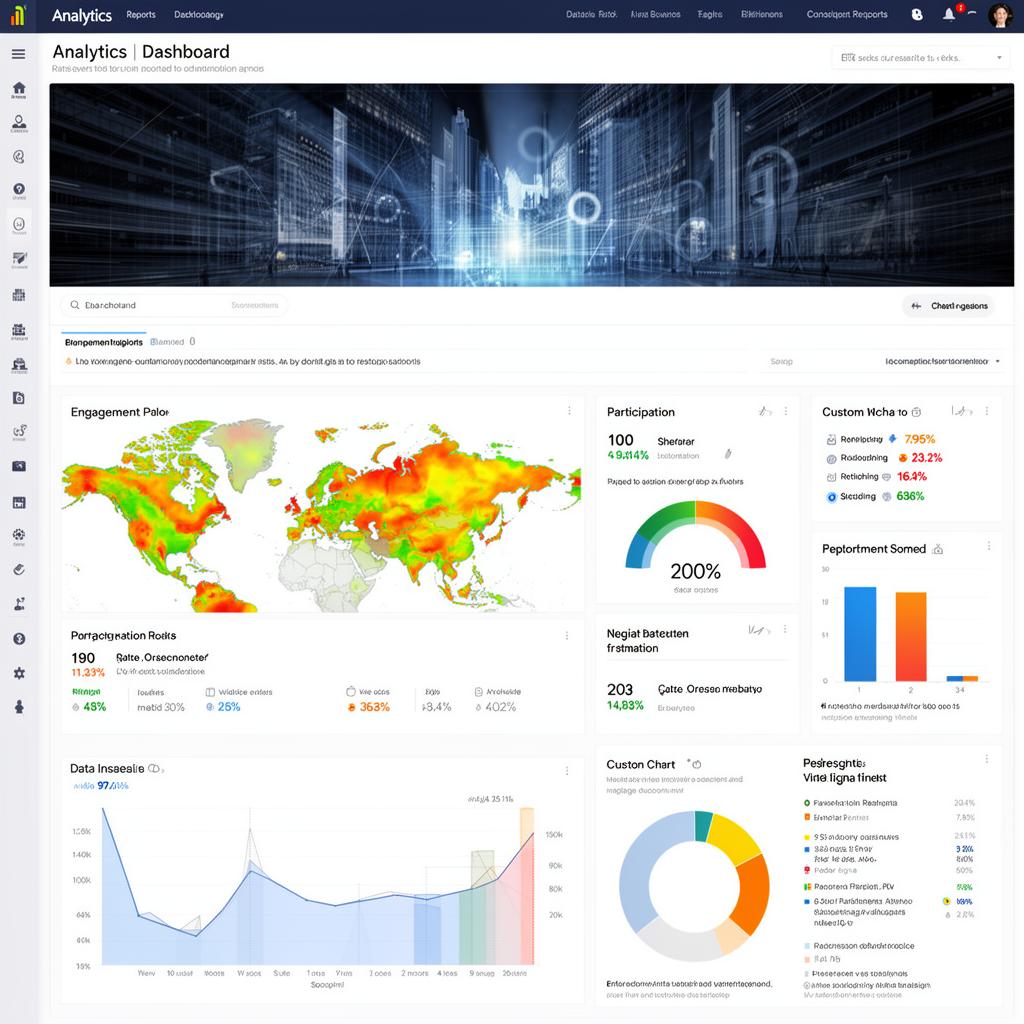
Data visualization techniques offer a powerful solution by converting complex datasets into intuitive graphical representations. For live events, this means creating dynamic dashboards, engaging word clouds, and interactive charts that update in real-time. These visuals provide immediate clarity and actionable insights for all stakeholders. By making data accessible and understandable, organizers can enhance audience participation and refine event strategies on the fly.
Key Benefits
- Enhanced audience engagement and interaction
- Real-time performance monitoring and adjustments
- Improved decision-making for event organizers
- Clear communication of key metrics to stakeholders
- Identification of emerging trends and sentiment
Implementation Tips
Successful implementation of data visualization for live events requires careful planning and the right tools. Focus on selecting platforms that integrate seamlessly with your data sources and offer customizable real-time display options. Prioritize clarity and simplicity in your visual designs to ensure immediate comprehension.
- Choose robust, real-time data visualization platforms
- Integrate with all relevant data sources (social media, polls, attendance)
- Design clear, uncluttered visuals for quick understanding
- Test visualizations thoroughly before the event goes live
- Provide accessible displays for both internal teams and attendees
Key Insight
Real-time data visualization empowers dynamic event management and enriches audience experiences.
Conclusion
Leveraging data visualization techniques for live events is no longer optional; it's a strategic imperative. By transforming complex data into compelling visuals, you can unlock real-time insights, foster deeper engagement, and make informed decisions that elevate the entire event experience. Start integrating these powerful tools to truly bring your event data to life.